Host Health Report
Stdlib Python collector that builds an interpreted host-health report (CPU load, memory, disk, optional log sample), writes JSON and text, and runs unattended on a systemd timer.
StackPython 3 · systemd timer · JSON · Linux /proc
SignalsCPU/mem/disk · interpreted report · systemd timer · JSON+text
Requirements outline
Scope this page covers. Each row is an acceptance item the automation targets; delivery is what ships in this revision.
| ID | Requirement | Delivery |
|---|---|---|
| FR1 | Real host metrics | loadavg + nproc, /proc/meminfo, disk_usage on configurable path, optional log tail |
| FR2 | Interpreted report | findings with severity + summary + detail; overall_severity worst-of core checks |
| FR3 | Structured output | JSON for machines and text for operators (format=both by default) |
| FR4 | Graceful partial failure | Per-collector try/except OSError; collection_errors in report; no bare except |
| FR5 | Configurable knobs | JSON config + CLI for thresholds, paths, format, output dir |
| FR6 | Scheduled unattended run | systemd .service + .timer; reports under /var/lib/host-health/reports with real timestamps |
Evidence
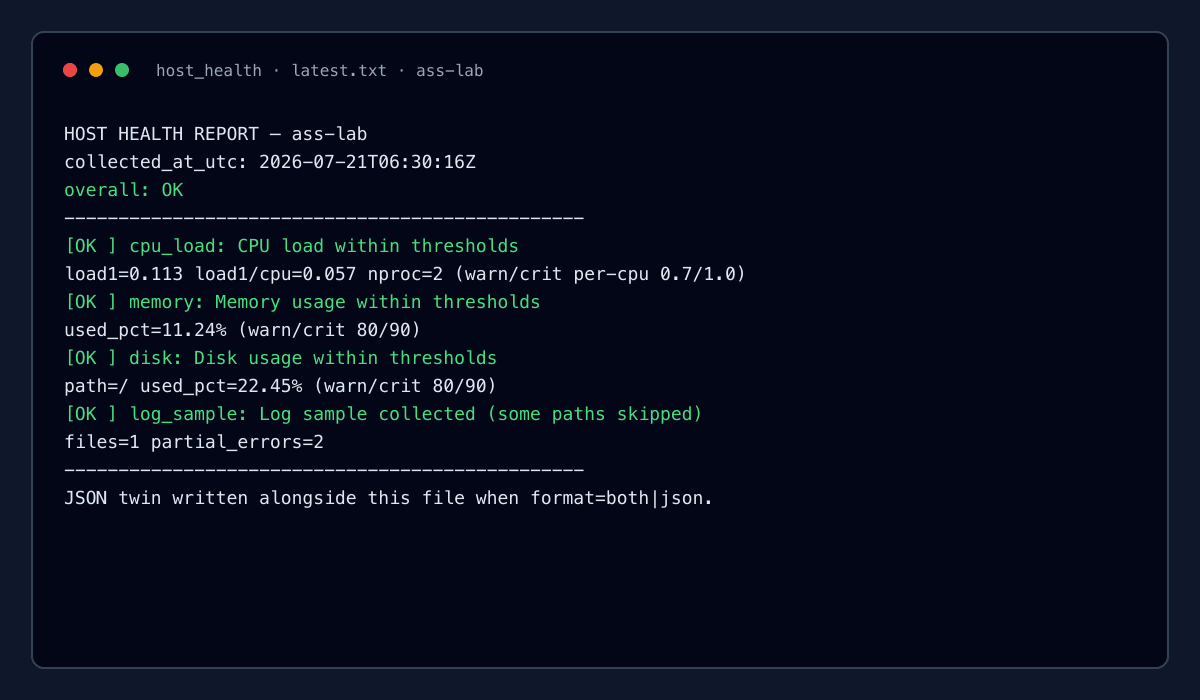
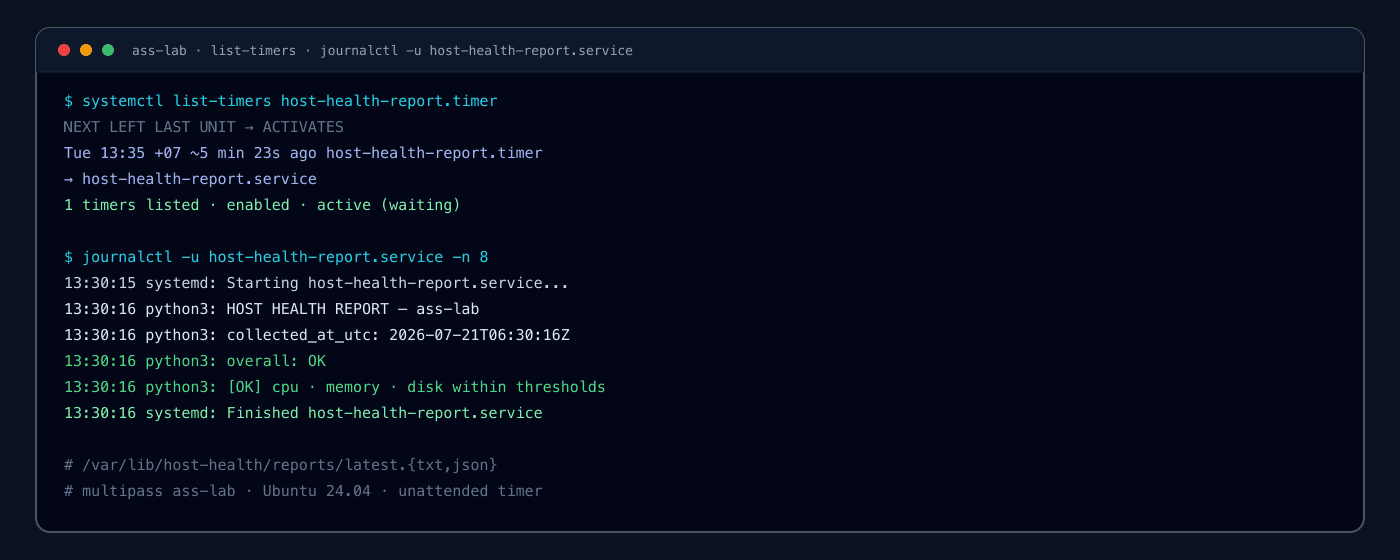
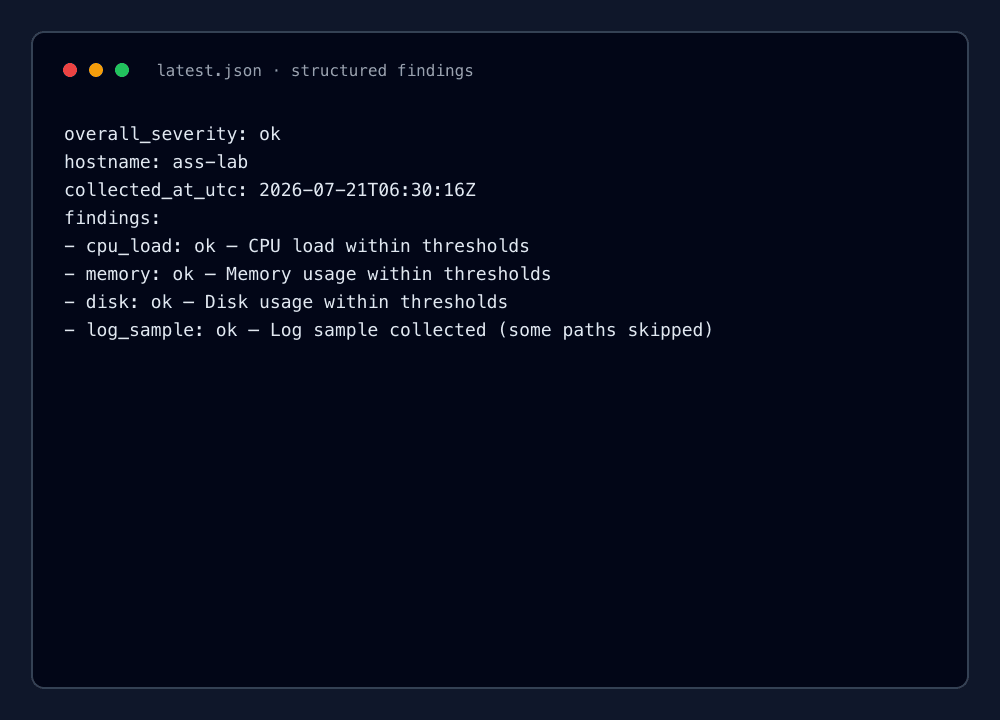
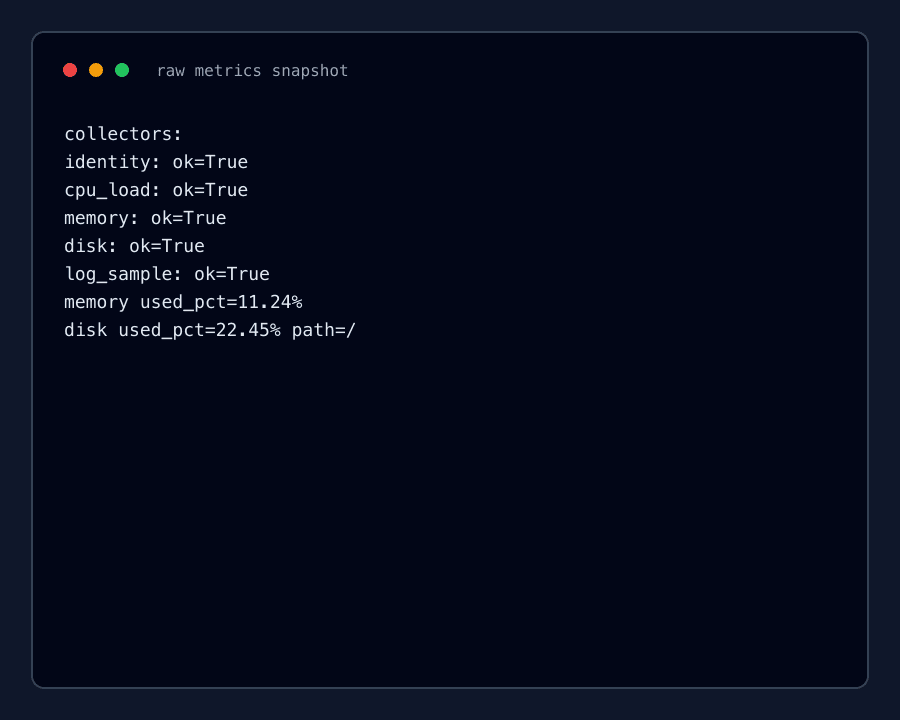
Terminal captures from the lab host. Click an image to expand fullscreen.
Problem
I needed a small, dependency-free way to sample host pressure on a Linux box, turn the numbers into a severity judgment against thresholds, and leave timestamped artifacts a timer can produce without me watching the machine.
Approach
Python package host_health (collect → interpret → report). Collectors for loadavg, /proc/meminfo, disk_usage, and optional log tails isolate OSError per metric. Findings carry ok/warn/crit/unknown with detail strings; overall_severity drives exit codes. Config via config/default.json plus CLI overrides. Deployed with a oneshot systemd service and a 5-minute timer under /opt on Multipass Ubuntu 24.04 (ass-lab).
Outcomes
- Manual and systemd-triggered runs write health-<host>-<utc>.json/.txt plus latest symlinks
- Timer host-health-report.timer enabled and active on ass-lab (every 5 minutes)
- Real latest.txt overall OK with CPU/memory/disk findings (evidence/ in repo)
- Partial log path misses stay informational and do not crash the run
- No third-party Python deps; no secrets